How To Read ETF Fact Sheets
Exchange traded funds (ETFs) can provide a favorable balance of risk and returns. But every ETF is different. And only some of them will be suitable for your specific investment objectives and risk tolerance.
As an investor, it is your job to research and compare investment options in order to pick the best one for yourself. In the process of finding an ETF to invest in, one critical aspect to look into is the ETF fact sheet.
Purpose of the ETF fact sheet
If you do a Google Images search for ‘ETF fact sheet’, you’ll come across numerous images of very professional looking reports filled with pie charts, bar graphs, trend lines, and numbers everywhere. This may seem daunting to read, but it’s actually really simple. First, let’s start by asking ourselves: why do ETFs publish fact sheets in the first place?
The ETF fact sheet often comes in the form of a 2-4 page PDF document. The purpose of the ETF fact sheet is to provide an overview of the ETF for investors to read. With any ETF, there is so much data and so many factors to consider, but not all information is equally important.

The fact sheet serves to condense important data into a concise document so that investors can get a quick summary of some of the most important information relating to the ETF.
On the fund manager’s official website for that particular ETF, they often provide so much data about different aspects of their fund, that it becomes difficult to locate important data like their top holdings, benchmark index etc. The ETF fact sheet thus serves the purpose of consolidating the data that is normally dispersed throughout their website, into a single report to save investors the hassle of locating such information.
Any ETFs mentioned in this article are stated purely for informational purposes, to explain the general interpretation of ETF fact sheets. This site does not give any recommendations to invest in any particular securities.
Locating the fact sheet
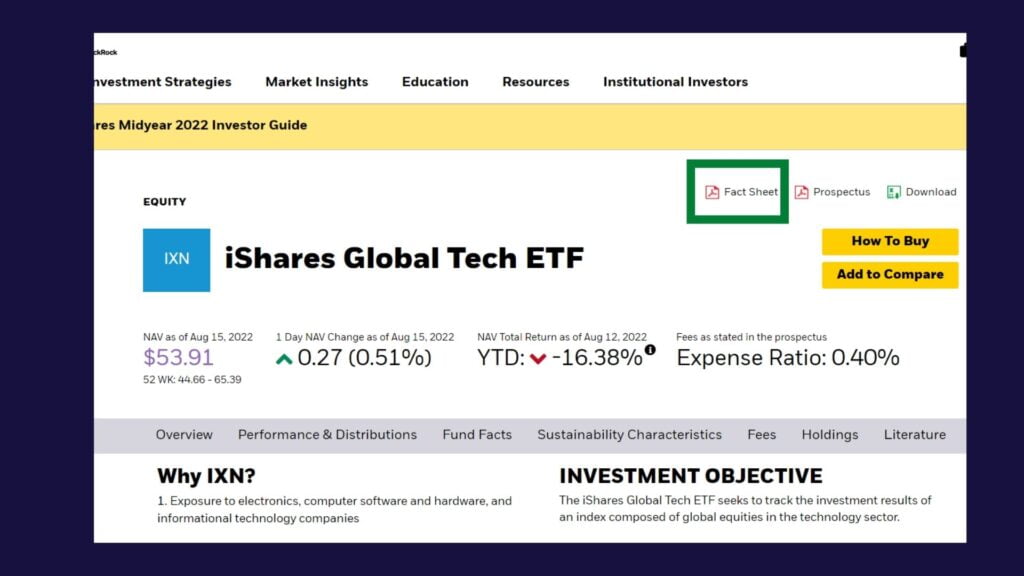
The ETF fact sheet is often found as an attachment on the ETF’s official site. All you need to do is search for the ETF name in Google and visit the website set up by the fund manager. Below is an extract of the official ETF website for iShares Global Tech ETF (IXN). As seen in the photo, the fact sheet is a pdf attachment on the site. The fact sheet is found on the ETF’s website for the majority of ETFs regardless of the fund manager.
In the rare exception where the fact sheet is not on the official ETF web page, it may be because it has a separate web page for itself. In such cases, simply searching “[ETF name] fact sheet” on Google search will direct you to a page where the ETF fact sheet is available for download.
Interpreting the ETF fact sheet

As mentioned earlier, the ETF fact sheet is consolidation of the most important data about an ETF. This means that everything in the fact sheet is there for a very specific reason. As investors, we look at the information and ask ourselves what are implications of the data on the future prospects of the ETF.
We will break down how to interpret an ETF fact sheet section-by-section.
Section #1: Fund overview
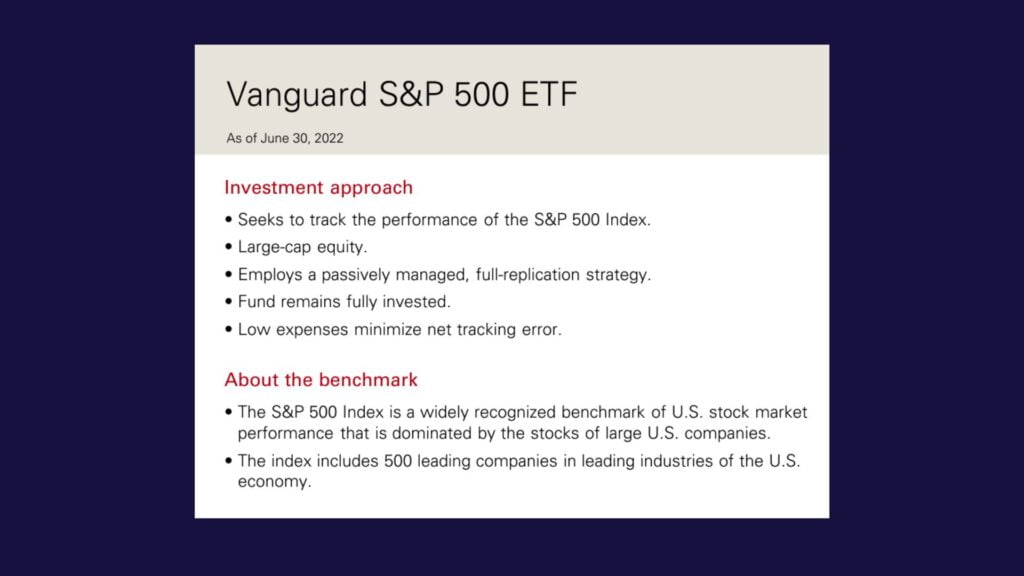
The least numerical aspect of the ETF fact sheet, the fund overview, sometimes called the “why choose us” section is a simple description of the objective of the ETF. This is an important starting point as it tells us what the fund manager is trying to achieve with their ETF. It is unwise to invest in any ETF where you don’t actually know what kind of growth the management is trying to achieve with their ETF
The extract above is taken from the fact sheet of Vanguard’s S&P 500 tracking ETF [VOO].
Ideally, an ETF fact sheet has a very clear and concise fund overview that plainly lays out their investment approach and aims. From this overview, we can get a broad picture of what to expect from the fund.
By reading the fund overview, you can get a general idea of how the fund managers are approaching their holdings and investments. Reading these statements alone should give you the broad picture of
- What kind of holdings the management wants to allocate in their ETF
- What index (if any) that the ETF is tracking
- How diversified or concentrated the ETF is
Section #2: Key facts and data
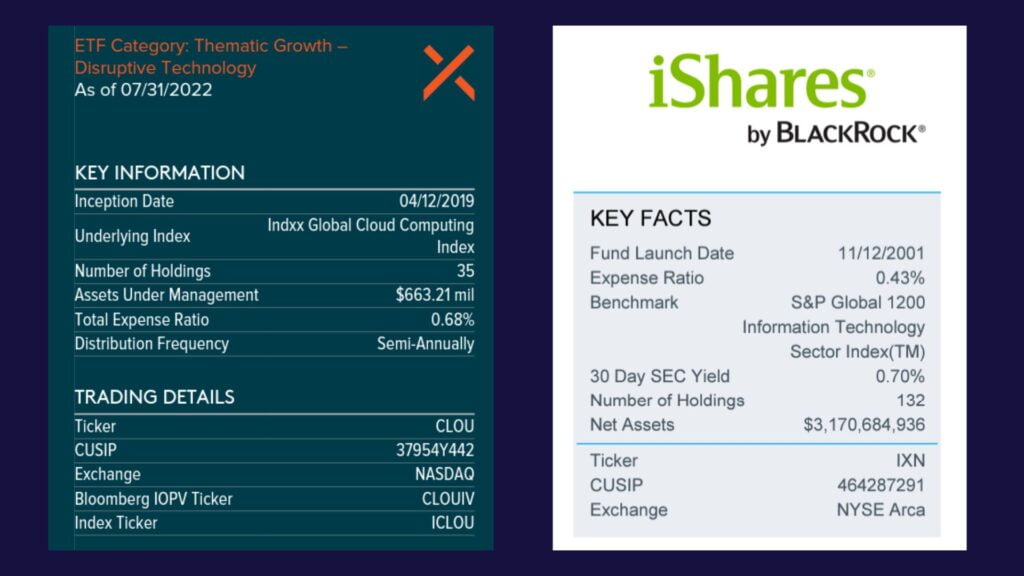
Every ETF fact sheet will have a section devoted to some of the major facts and data about the fund. This section is almot always located in the upper corners of the first page since the data is so important.
Important data found in this section
- Inception/ launch date – tells us how long the ETF has been around
- Underlying/ Benchmark index – if your ETF tracks any specific index, it will be listed here.
- Number of holdings – Refers to the number of securities (a.k.a investments like stocks) that the ETF comprises of. So for example you would expect something like an ETF that tracks the S&P 500 to have around 500 holdings as well.
- Ticker symbol & Exchange
- Expense ratio – The percentage cut of your investment that you have to pay as a fee to the fund management for buying into their ETF.
- AUM – Assets under management
Section #3: ETF Performance
Performance is the metric that investors all love to rave over. While the returns are an important metric to consider, analyzing this section goes far beyond looking at the growth.
Important data found in this section:
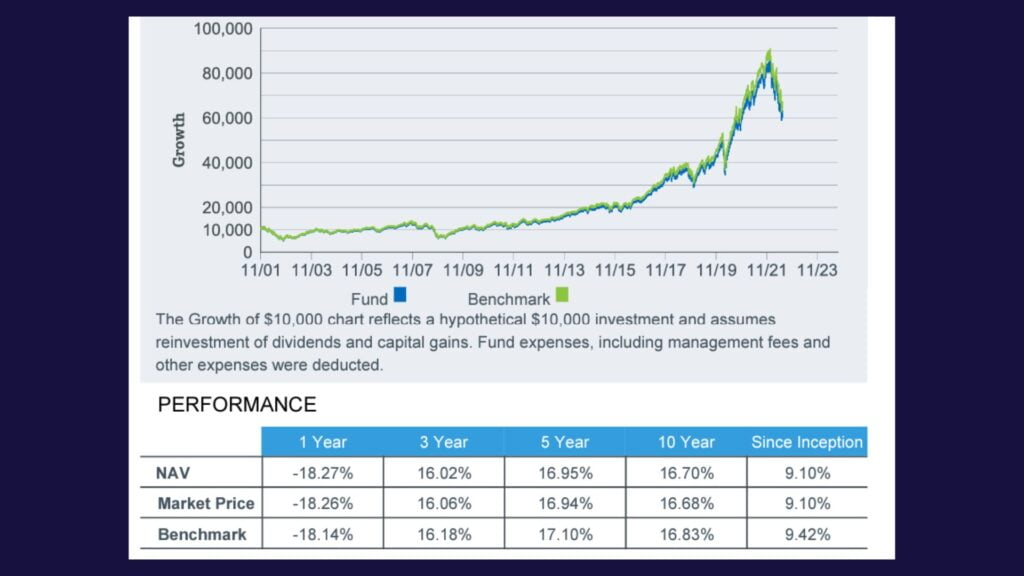
- Tracking accuracy – As mentioned earlier, many ETFs track the performance of indexes. In this section, though it is often not explicitly stated, you can see how well the ETF tracks its underlying index by calculating the discrepancy between the returns of the index and the returns of the ETF.
- Average returns over time periods – Pretty self explanatory. There is often a table showing the average annual return of the ETF over various time periods. Always remember that past performance does not guarantee future performance.
Section #4: Top Holdings
An ETF may hold anywhere from a handful, to hundreds of investments. Many investors are not concerned with every last holding comprising an ETF. They often look only at the top few holdings that make up the most significant portions of the ETF.
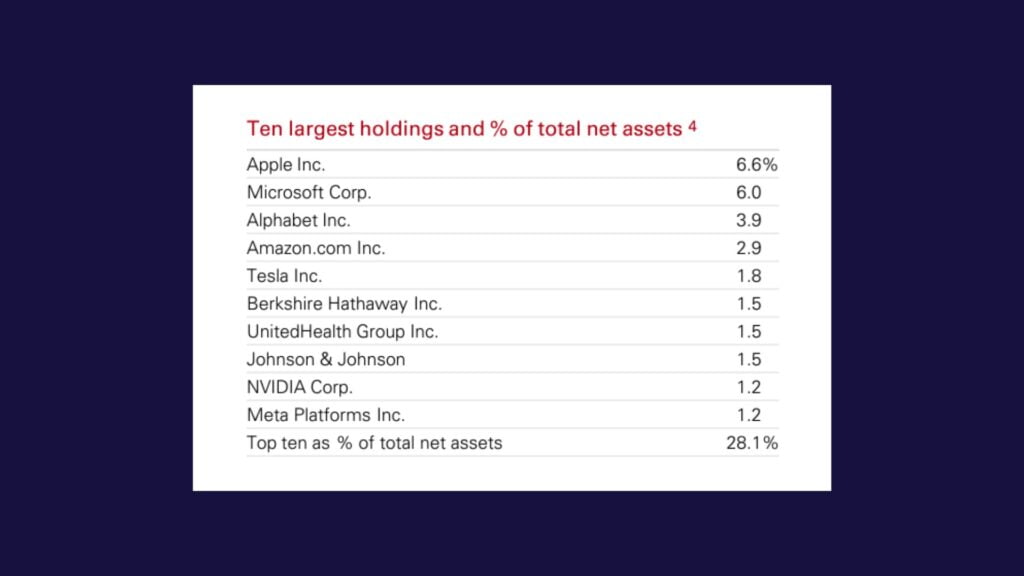
Most fact sheets show the top 10 holdings in the ETF, with some providing a helpful sum at the end that shoes how much the of net asset value the top 10 holdings take up as a percentage of the total ETF value. This tells you how diversified the ETF is.
In the example, the Vanguard S&P 500 can be considered well-diversified since the top 10 holdings still only make up 28.1% of the total assets held by the ETF. For more niche ETFs, there tends to be lower diversification. For example, in the VanEck Semiconductor ETF (SMH), the top 10 holdings make up 58.39% of the total ETF value. Thus, this is an important criteria to take into account and varies from investor to investor depending on your desired level of diversification or concentration.
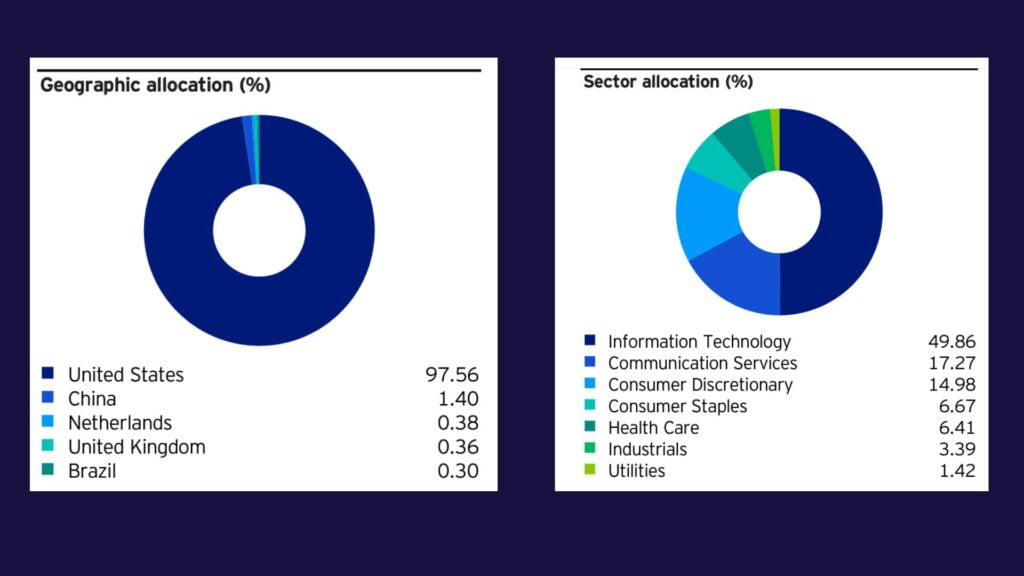
Section #5: Sector & Geographic Breakdowns
The final portion of the fact sheet is the Geographical and Sector composition charts. They are almost always the only two pie charts you’ll find in the ETF fact sheet. This is an important aspect of diversification that is commonly overlooked. Investors often look at the diversification in terms of individual investments, but rarely in terms of geographical diversification and industry diversification.
(A): Geographical diversification
Some investors will avoid investing in ETFs that are too concentrated in a single country, since unpredictable events like wars, political turmoil, or poor governance can cripple the country. For instance, many investors may choose to avoid ETFs that have high compositions of China or Taiwan stocks amid rising tensions.
Though investors can try their best to diversify geographically, given that globalization has made the world so interconnected and interdependent, it is unlikely that conflicts will only have localized effects. We see this in instances such as the Russia-Ukraine war of 2022 affecting global stock markets.
(B): Sector Diversification
Another form of diversification is investing across different economic sectors. An investor might feel optimistic about the future prospects of one sector, and be pessimistic about another. If that’s you, then looking at the sector allocation of an ETF might be something you’d be interested in.
Conclusion
ETFs can be fantastic investment options to facilitate wealth building, if selected properly. The ETF fact sheet is one of the most important documents you should read as an investor before buying into an ETF.
Being a consolidated report, the ETF fact sheet contains a lot of highly pertinent data that cannot be ignored or overlooked in your assessment of an ETF. But it is not a perfect summary. There may be other relevant information or numbers found on the ETF’s website that is not included in the fact sheet.

